
|
|
Lousy mileage?
Why do motorcycles get such poor fuel mileage compared
to many cars, which are vastly bigger and heavier?
How much horsepower and/or torque increase does it take
to improve performance? What about RAM AIR?
What is the best cruising RPM?
Premium fuels versus mileage and combustion temperatures.
� Copyright 2022, R. Fleischer
https://bmwmotorcycletech.info/FuelMileage.htm
9B
Part 1, Overview:
All objects .....cars, motorcycles, bicycles .....and you! .....when moving through air .....create friction and drag. On Earth, the weight of the atmosphere, held to the Earth by gravity, causes a higher pressure at sea level, than it does on a mountain top. The higher you go with your motorcycle, the faster you should be able to go, theoretically, due to less friction with the air ....or; conversely, the less power from your engine you would need for the same speed as at sea level; due to the reduced air drag. While friction and drag are not the same, you can regard them as the same for this particular bit of reasoning, which, other things not considered, is true about the speed, etc. If your motorcycle (and you!) are not moving, but if you are exposed to the wind, that creates friction and drag. Of course, if the wind is moving towards you while you are riding, that creates drag too.
As altitude increases, the oxygen content of the air is less (by weight), and your engine will have less power as you go up in altitude, which will reduce performance increases from less air drag and less friction. In some instances, fuel mileage will increase with an altitude increase, especially so on fuel mixture compensating engines, such as those with fuel-injection. Mileage may decrease or increase, especially in hilly or mountainous riding. Sometimes supercharging or turbocharging can improve fuel mileage, particularly with small engines with smaller combustion areas (cylinders and heads). Mileage usually goes down, often on a quite steep curve, as you use more and more throttle. Many factors enter into fuel mileage.
CARS, especially modern ones, are designed to slip through the air with relatively low friction and drag, so as to get the best possible fuel mileage consistent with such as body shape appeal and many other factors. Manufacturers generally do everything reasonably possible to reduce friction and drag within design and function restraints, due to various government-imposed penalties for poor gas mileage, not to mention as a selling feature. There are limits to designs that would be acceptable or practical. The shape of the car, friction of tires, closeness to the ground, irregularities in bodywork and under the car, and literally many hundreds of things, all have plus and minus effects on fuel mileage.
Motorcycles are generally designed for performance, not necessarily fuel mileage; although that is a factor. There are large differences between various motorcycles depending on what the designers/engineers intended. Some motorcycles are designed strictly for performance; particularly regarding acceleration, very high speeds, and stability at higher speeds. Some are quite compact, presenting a small surface area to the oncoming air, which helps fuel mileage. Some motorcycles are quite large and heavy, yet designed to get good mileage.
When an engine is designed for powerful vehicle acceleration, fuel mileage may, and usually does, suffer.
Motorcycles into the late seventies used carburetors having rich mixtures for better power and performance and this was particularly so for air-cooled engines. From approximately 1980, some modest emissions standards were applied to motorcycles. Emissions standards for motorcycles resulted in leaner-burning and hotter running engines, where previously the fuel mixture richness provided some extra cooling in the combustion chamber. Even with fuel injection, mixtures on some high performance bike engines tend to be 'somewhat' on the richer side; using more fuel. This is particularly so for high performance motorcycles. In particular and quite notable, camshaft timing and other such 'tuning' was such that some fuel tended to be wasted, particularly during aggressive acceleration.
Fuel is used for cooling and slowing the burning mixture, and a slightly more fuel-rich mixture will usually provide more horsepower. This wasting of fuel is much more pervasive during fast acceleration, than at constant road speeds. The mixture must be rich enough to avoid such as engine stumbling or poor throttle response.
On fuel injected engines, the fuel may be electronically turned off when the throttle is backed off.
As speeds rise, the power required greatly increases. Fuel usage is not on a flat upwards curve with speed ....rather, it is on a quite non-linear and increasingly steep curve. This is particularly so on vehicles with high coefficients of drag. I will get into this in depth later in this article. The basic idea you should have at this point of discussion is to consider not acceleration, but constant speed ....and the idea here is that for every same increment of speed increase, the fuel required becomes more than for the previous similar increment. If you were traveling at a constant 50 mph, and previously had been at a constant 45 mph, you used a certain amount more fuel per mile, for the extra 5 mph of speed (not considering the acceleration to get to 50 mph). For 55 mph, you use MORE than the just the extra amount for the constant 50 mph. The faster you go, this idea continues, and is, as noted, on a fast rising curve. It actually approaches a cube function! F�
The Coefficient of Drag (Cd), is a huge determining factor on performance (and fuel use) as constant speed increases. The amount of fuel used to accelerate to the new higher speed is also increased greatly. Cd is not a straight-line function; which many thinks it is ....from looking at only one of the two formulas involved with drag and horsepower required. Cd is a complicated thing to measure without a wind tunnel or some fancy computer and graphics work. For those that appreciate old ways of doing things, yes, it is possible to get a working approximation from a photo and a type of graphing paper, and a lot of pencil work. Cd 'area' charts are not very usable on a practical basis for anyone but an engineer. Motorcycles, particularly large touring bikes, have a very high Cd, and hence get poor gas mileage compared to a car; much worse in comparison, considering the weight and size difference.
Motorcycles have been designed and built that get very high fuel mileage, but these are almost always totally impractical as vehicles to carry a rider. Craig Vetter used to have yearly contests for high mileage modified motorcycles. He is, lately, back into this again!
Motorcycles do NOT slip through the air with low friction and drag. Even motorcycles with well-designed full fairings are 'dirty' as far as friction and drag goes ....compared to a small car and many a large car. Motorcycles have a huge number of exposed parts, each of which presents its own interference disturbance with the desired smooth flow of air. These air disturbances, many of them small, tend to interfere with each other. Some parts will affect the air before other ones do. Thus, there is constant "interferences mixing". The over-all effect is a lot of friction and drag. A motorcycle might actually do better at fuel mileage if it was a square ugly vehicle ....a long rectangular box!... or, at least an ugly non-streamlined car.
Think about this in another way. Suppose a motorcycle has a streamlined-looking fairing, and it was traveling through air full of multi-colored smoke. Suppose you were some decent distance away, but able to stay at the same speed, and look sideways towards the motorcycle. You would see that smoke travel around and about the motorcycle in very strange ways. It would have all sorts of ripples and strange movements. Just talking about a factory stock fairing (only!) ....typically, as the smoke-filled air passed the rear edge of the fairing, it would be seen to combine horizontally and vertically (air is coming over the windshield, and the rider...) ....and try to rejoin the air doing the same sort of thing on the other side of the motorcycle. One fundamental reason for this is that when the oncoming air strikes curved surfaces, it accelerates, creating a lower pressure, that varies from surface to outwards somewhat. Thus, the pressure difference alone causes a tendency to re-combine. Highly streamlined motorcycles, usually fish-shaped, are used in top speed trials/racing, at such as the Bonneville Salt Flats. The longer the fish shape, in general, the more likely the air disturbances will recombine behind the motorcycle; and, in fact, if this is controlled well enough, that can actually give a forward push on the motorcycle. If a fairing could be extended to a number of feet behind the motorcycle, and the entire structure made to look somewhat like a fish, then the friction and drag would be greatly reduced. That is not practical for a street-going motorcycle. Most high mileage motorcycle designs look something like a fish. As you might very accurately think, the effect varies with speed, and SOMETIMES only a rather narrow band of speed will let the effect be worth much.
If saddlebags, or a passenger, or a passenger backrest, or a tour trunk ....are on a motorcycle ....air currents would strike these things in all sorts of weird patterns .....and cause additional friction and drag.
In the classical way of thinking about friction and drag, one converts by one means or another the ongoing face and structure of the vehicle into a equivalent 'flat plate', of some number of square feet and square inches, and then calculates using commonly known mathematical formulas, the Coefficient of Drag, Cd.
You could do that yourself, by taking a photograph from the front, enlarging it greatly, and then calculating the area of things and of no things, in the photograph. If the photograph was full size, you could, with some effort, calculate the number of square feet and square inches, of effective frontal area. The answer would not be completely accurate, however, as all those air flows around and in-between everything do interfere with each other, making things worse than calculations by area alone. But, you would get some decent information about Cd ....at least as far as converting to flat plate area. In the real world of doing this, you could make a huge chart with small identical-sized squares, and then doing area calculations. For over-all design purposes, Cd work is almost always done by means of a wind-tunnel with full instrumentation; and preliminary work is almost always done by means of 2D and 3D computer software. Special software programs are used with computers to do the final analysis of the wind tunnel measurements.
Road-going production motorcycles generally have a quite poor Cd compared to any modern car. A motorcycle uses a fair amount of horsepower to maintain any speed, let alone accelerate or get to high speeds. Using horsepower means using fuel. Increasing engine efficiency in its burning of fuel has a very small effect, compared to Cd. A large bike getting perhaps 38 to 44 mpg in steady riding at perhaps 60-75 mph, might gain as much as 5 mpg more by going from carburetion to fuel injection, with a few other changes ....and maybe a few more mpg if the rear drive ratio was flatter, allowing the engine to turn more slowly.
All road-going vehicles have tire friction with the road that produces heat. That friction is needed, but it is a user of horsepower. It could be thought of as power that the engine produces that ends up as heat from the tire friction (from contact, squirming, shape change, etc.) that is transmitted into the road surface ....and into heating the tire itself. There are other ways of thinking about this sort of thing ....such as the air resistance of the tire/wheel combination to-the-surface (including the rolling air wedge), effects of the wheel spokes, and many many other small things ....all of which tend to add up. These effects also use horsepower in maintaining any given speed.
So, what is typical fuel mileage for an Airhead, in fact, what's typical for most motorcycles?
Depends mostly on how you ride .... Aggressively? Higher speeds? Higher rpm? On and off the throttle a lot? ...etc. 10% alcohol in your fuel lowers fuel mileage, by ~5 mpg. High ratio rear drive lowers fuel mileage; typically this is 10% or so (~5 mpg reduction). Saddlebags and tail trunk lower mileage. Many windscreens lower mileage. Sitting very tall in the saddle lowers mileage. Passengers usually cause a lowering. Richer settings in the carburetors beyond the optimum setting will always lower mileage. Side winds and head winds will reduce mileage, sometimes drastically. Probably 35-51 miles per American-sized gallon is typical for most Airheads, for typical use. Only a few large motorcycles will get as much as mid-fifties. Some, if driven quite gently , may obtain as much as 60mpg; others will be in the high twenties. Airheads can sometimes reach 50 mpg. Your average speed is quite important. As speed increases, mileage goes down on a steepening curve.
The mpg of a sidecar rig is lower, but typically the effects are on a broader curve, but with high steepening. Usually sidecar rigs have larger motorcycles with larger engines, often with rear drives and smaller tires that result in a considerably higher drive ratio
....and the drag is very high on any sidecar rig, some are exceptionally 'dirty'. It is typical, for highway use, for a sidecar rig to get ~33 mpg.
Bottom Line: Motorcycles are generally very 'dirty' compared to even pretty decent size cars, as far as Cd is concerned, and fuel mileage is not great.
Part 2, The basics .....first, the easy to understand things:
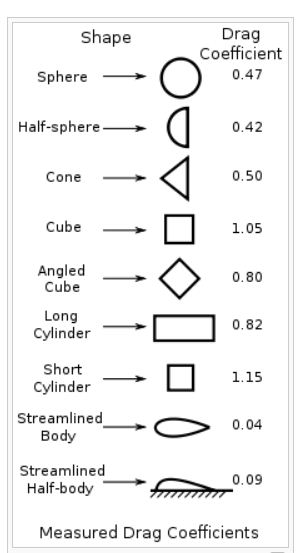
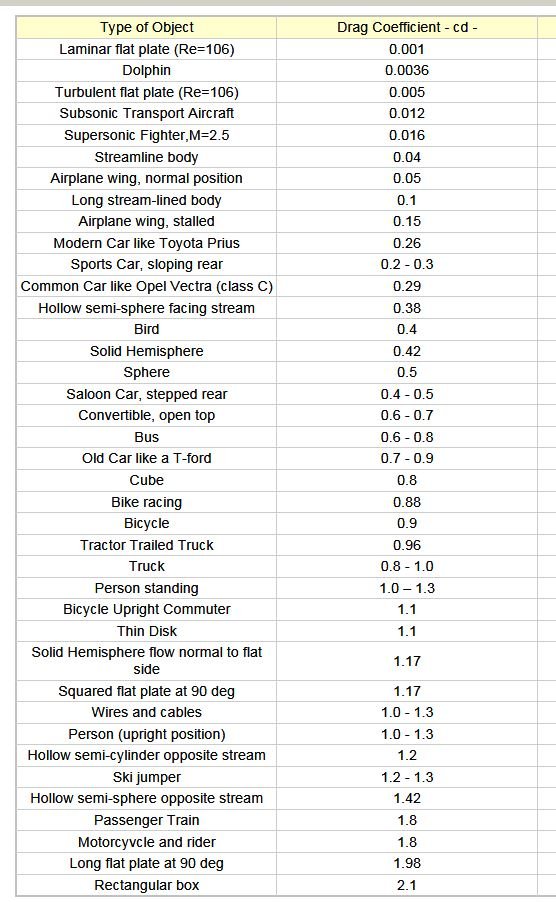
Drag varies with shape. A flat disc, moving through the air, flat surface forward, will have a Cd of approximately 1.1.
Here are two simple charts for easy visualizing. Note that these two charts are a comparison of Drag Coefficients for shapes. They are here to compare shapes, only, and ONLY within the particular chart;.....do not try to use these two charts for absolute measurements of drag amounts ....that is in a following chart.
Wind Tunnel results. Some of these values may surprise you!
|
Drag |
Vehicle |
| 0.0224 |
F4 Phantom fighter jet |
| 0.189 | VW hybrid diesel-electric model VW XL1. Requires only 8.3 Hp to maintain 62 mph |
| 0.25 | Toyoto Prius, all models & versions are approximately this value |
| 0.25 | Rolls Royce, battery-powered car, the Spectre |
| 0.26 | BMW i8 hybrid car; Mazda 6 |
| 0.28 | Snowbum's Alfa Romeo Giulietta Sprint Special�; C6 Corvette |
| 0.303 | Honda, 1996, RS125GP |
| 0.32 | 2015 Mazda Miata |
| 0.33 | Subaru 2014 Forester |
| 0.35 | Lexus LX570 SUV. |
| 0.38 | BMW K1, rider sitting upright |
| 0.43 | BMW K100RS, rider sitting upright |
| 0.495 | BMW K100RT, rider sitting upright |
| 0.562 | Vincent Black Shadow, rider sitting upright |
| 0.571 | BMW R100RS, per 1980 German magazine "Motorrad" |
| 0.589 | BMW R100S, per 1980 German magazine "Motorrad" |
| 0.6 | Approximate for the Suzuki Hayabusa |
| 0.627 | BMW R100, no fairing, per 1980 German magazine "Motorrad" |
| 2.1 | Common brick used in construction |
Approximates:
| Vehicle description | Drag low | Drag medium |
Drag high |
| Experimental | 0.17 | 0.21 | 0.23 |
| Sports | 0.27 | 0.31 | 0.38 |
| Performance | 0.32 | 0.34 | 0.38 |
| 60's Muscle cars | 0.38 | 0.44 | 0.50 |
| Sedan, newer | 0.34 | 0.39 | 0.50 |
| Motorcycle | 0.50 | 0.90 | 1.00 |
| Truck | 0.60 | 0.90 | 1.00 |
| Tractor-Trailer | 0.60 | 0.77 | 1.20 |
The following information was derived from wind-tunnel measurements, and is expressed in different units. The conclusions you will make are quite valid!
| Cd (drag area) | VEHICLE (CdAf�) |
| 5.54 | Ferrari 308 GTB, year 1980 |
| 5.61 | Mazda RX-7, year 1993 |
| 5.92 | Porsche 911, year 1994 |
| 6.24 | Toyota Prius, year 2004 |
| 6.27 | Porsche Carrera, year 1986 |
| 6.81 | Subaru Legacy, year 1989 |
| 7.34 | Honda Civic, 2001 |
| 7.57 | Toyota Camry, year 1992 |
| 8.71 | Buick LeSabre, year 1991 |
| 16.8 | Hummer H3 |
| 18.06 | Hummer H1, year 1993 |
| 26.3 | Hummer H2, year 2006 |
Want to know about other vehicles?
Want to know Cd, and not CD-A, what about total drag? ...try the links below.
First: http://en.wikipedia.org/wiki/Automobile_drag_coefficient
That article has a very long list of Cd's, for COMPARISON ONLY AS ON THAT LIST. That is because there are different types of drag measurements in use. The article measurements were not taken and expressed in the same values and methods, so use their tables/charts/lists, for comparison purposes, within a chart or listing, only! As drag coefficients get quite small, the differences become less and less.
More places:
http://elmoto.net/showthread.php?t=3400
https://info.simuleon.com/blog/how-to-calculate-drag-coefficient-for-motorcycle
NOTE: Cars generally have the edge over bikes, as speed increases greatly, due to the dynamic characteristics.
Part 3, Getting into the actual mathematics:
I put two formulas below, and will do a bit of discussion about each. These are not my made-up formulas, but well-known classic formulas.
Formula #1:
Fd = (1/2) Pv2
ACdV
For the above formula, Fd is the drag force; P is the density of the medium ...in the examples I mean air density; V is the direction of the velocity; and A is the area, usually taken to be an orthographic projection on a plane perpendicular to the direction of motion. If not 'simple', such as a sphere (your motorcycle certainly is not a sphere!), then one needs to calculate for each and every area. Finally, v is the speed, relative to the medium.
NOTE!.....did you see that air density, P, is a direct factor? That is JUST ONE reason that as altitude goes up, your fuel mileage will go up, all other things constant. I hope you noticed that speed is a squared function!
For an object with well-defined points (HAH! for a motorcycle!), such as a circular disk plate, perpendicular to the flow, then Cd is a constant for Reynolds numbers over about 3,500. Cd is a function of the orientation of the flow. There are many types of drag, one of which is FORM DRAG, which is pressure variations around the object.
There is no need for you to get deeply into formula details. The important part is quite simple. The drag force is proportional to the SQUARE of the SPEED. If the drag is proportional to the square of the speed, guess what that proportionality means to horsepower required (and gasoline required!)! Your guess would LIKELY BE WRONG!!
It is at this point that confusion sometimes comes about, and arguments can start. That is because fuel usage ...and horsepower requirements...are NOT proportional to the square of the speed. The confusion and arguments probably come from MISUSE of the information in TWO formulas. You can NOT use just ONE of these formulas. They MUST be combined OR BOTH USED ...and with understanding. I have NOT combined the formulas, because I want YOU to easily understand the reasoning why the increased horsepower required for a higher speed is not proportional to speed, nor to the square of the speed ....but is to an even higher figure. Yes, I am going to simplify this and explain it.
Formula #2:
Power required = Av + Bv2 + Cv3
Let's take a look at that formula:
A is the resistance....which includes the tire rolling resistance...this is a linear function.
B is mostly concerned with internal engine friction components.
C is the aero-forces, including the coefficient of drag, air density, and so on. NOTE that, as opposed to the previous formula, C is being multiplied by v cubed and added.
v, as before, is the velocity, or speed.
There is no need for you to get deeply into formulas. The important part is actually simple. The engine power required is proportional to the CUBE of the VELOCITY (that means speed) as far as as the external things are concerned. NOTE that ENGINE POWER is directly proportional to fuel consumed.
How to reason it all out, if you are still confused by the math:
One formula says that drag force is proportional to the square of the speed.
The other formula says that the power required is proportional to the cube of the speed.
Both formulas are effective at the same time for your motorcycle.
Power needs go up MUCH faster than drag force, as speed is increased.
If the actual power needed is going up at a faster rate than the drag (and other) force effect ...then the FUEL needed is going up at that faster rate too!
Part 4, Additional information:
There is a lot of very wrong information posted on the Internet, and even in printed books, about Cd, Cd-A, etc. Much of the wrong information is due to those persons who are writing these things failing to understand that two formulas are in play, and must be used together. Many do not understand CD, nor the effect on Cd from various object shapes. Many of these websites are done with lots of mathematics, and look scholarly. I think many copy from each other & re-arrange things. In my discussion of Cd, and Cd-A, above, I have simplified things for your easier understanding.
Here is a link to an article written by Tony Foale on aerodynamics. Tony's work you can generally rely on.
http://www.tonyfoale.com/Articles/Aerodynamics/AERO.htm
One of the things that always has bothered me is the various posted information is used as if it is universally accepted as being correct. That there is more than one type of Cd is not even mentioned (nor understood by the authors). A Cd 'chart' of curves is misleading, if you do not factor-in the rest of the information, particularly the rest of the math. One of the reasons I posted the various charts in this article was so you can compare WITHIN a chart; and, see why there are differences BETWEEN charts; and that you will, perhaps, be better informed about the two main types of Cd figures.
There is another type of chart that is sometimes of interest. That chart displays fuel consumption versus weight of the vehicle; and are usually thought to be accurate, in showing a doubling of weight as a doubling of fuel consumption. If only that sort of chart was used, in reverse, you could say that a light weight motorcycle should have monstrously better mileage than any car. NOT SO, as you have seen in this article you are reading. Do NOT jump to the conclusion that I am wrong here, after all, some mopeds get 80 mpg or more! While true, the wrong use of the charts and formulas, as many do, will likely show that a light moped should get MANY HUNDREDS of miles per gallon. Thus, ideas are often expressed, without analyzing or thinking.
I am aware that few of you will take the time to really read & think about the formulas and interpreting them. I expect few of you will do more than skim even my minimal conclusions in this article ....but I HOPE some of you DO, and I hope ALL of you take away the real reasons for lousy motorcycle fuel mileage, and the principles, at least in a broad sense, of why fuel mileage goes down so very fast as speed rises ....and why this happens so quickly with motorcycles.
Below is an interesting chart. It does not have a curve for very large displacement big cruisers and touring bikes, but it is going to be from about 0.48 drag area to about 0.75, with a few even a bit higher. Notice how quite high speeds shows the drag curves separating more and more, ....in other words, the curves STEEPEN for the 'less-slippery' motorcycles.
Part 5, Equivalents & Conversions:
cubic inches x 16.39 = cc
liters x 61.02 = cubic inches
cubic inches � 231 = gallons
Imperial gallon x 1.2 = U.S. gallon
mpg x 0.354 = km/L
km/L x 2.825 = mpg
Km x .621 = miles
one Km is approximately 5/8th of a mile.
Part 6, Pumping losses; engine friction; efficiency versus load; cruising RPM considerations:
In the mathematics in this article (up to this point) not every possible item and effect is discussed. The inefficiency, that is, less-perfect, use of carburetion versus fuel injection is slightly dealt with. Engine pumping losses are not discussed, which can be high, and should be considered, especially for carburetor-equipped bikes. Pumping losses are relatively high in any engine, no matter if carbureted or not; particularly at part-throttle.
The friction losses increase with a change to larger pistons, as piston sides area and rings contacting area increase. This increase is a square function too, so losses with larger displacement in a cylinder increase fast. Friction is power robbing. That means more throttle is required. Obviously, the more distance the piston travels, the more friction per stroke, thus the stroke length has an effect. A loss of heat robs fuel mileage some too, and the larger the piston means the larger the cylinder, and the larger the surface area that is absorbing combustion heat.
An item with a very big effect is camshaft timing.
A gasoline 4 stroke engine is more fuel efficient at higher loads. Engine friction from just RPM is often said to vary linearly with RPM, which is close to the truth. Friction uses up horsepower.
A primary reason that the engine becomes less efficient as you close the throttle is due to pumping losses. Most gasoline 4 stroke engines have a throttle plate butterfly valve, perhaps called by that name. Motorcycles with fuel injection to a manifold, and also slide-only carburetors can both be lumped in with those. There are several types and situations of pumping losses, but, I am using the term to include them all. Pumping losses are a major effect.
There are other variables, such as engine friction changes as pressures in the cylinder change, these effects are smaller, and all others not mentioned are also MUCH smaller.
One thing often not thought-of, is that, at its core basics, our engines are HEAT engines. That is, the combustion process produces heat, and expanding gases. The force of the expanding gases (rise in pressure) moves the pistons inwards, which produce the power we lust after. The energy in the combustion process is NOT efficient, and a LOT of the energy is sent out the exhaust system, and a fair amount is also radiated into the air via the cylinders and cylinder head (and, water and radiator, in water-cooled engines), and some is also removed by the conduction/radiation of the lubricating oil. It takes a lot of power to just make the engine move AND TO COMPRESS THE FUEL-AIR, BEFORE IT IS IGNITED. THOSE ARE PUMPING LOSSES! Pumping losses occur whether you are using the throttle for power or not, and in carbureted engines, fuel is wasted when the throttle is off, and you are slowing down, or, heck, going downhill faster, whatever. The carburetor idle circuits are not shut off on carbureted engines with the throttle turned off.
The chart below is self-explanatory. One can expect somewhat of a similar chart for any given engine. Do not idly take a quick look and pass this chart by. STUDY THIS CHART!!
Something even a brief look at this chart will tell you, is that the gearing ratios from crankshaft to rear wheel is important; as is what transmission gear to use. All must be tempered with the consideration that trying for maximum mileage by overly heavily loading the engine can be BAD for its health.
For the Airheads, assuming 4th gear (4 speed transmissions) or 5th gear (5 speed transmissions), where the transmission ratio is identical (1.5:1), the rear drive ratio has a noticeable effect on fuel mileage, both for over-all real world driving, AND constant speed driving. Read the next sentence carefully. It is obvious from the chart that using a fair amount of throttle at lower rpm, roughly 3,000 here in this example chart. This chart is NOT DIRECTLY FOR ANY SPECIFIC AIRHEAD, but is quite usable for information for an Airhead. Another takeaway from a look at this chart will show that or any given transmission gear, there is an optimum RPM for best mileage, with heavy engine loading, because you can load the engine to any % in any gear.
For the engine for which this chart applies, you can see that around 4000 rpm is a good rpm for typical cruising on the open road, but if at much lower speeds, cruising at 3300 rpm will give particularly good fuel mileage. NOTE that the chart below is not that of a specific Airhead engine, but the idea, and curves shapes, are typical. Modern cars tend to use adjustable camshaft drives, coupled with quite high compression ratios, small displacements, and rather flattish rear drive ratios, all of which maintain power and performance yet give good fuel mileage, some even give good mileage when a lot of power is being used in a sporting manner. Your Airhead was not designed for mileage.
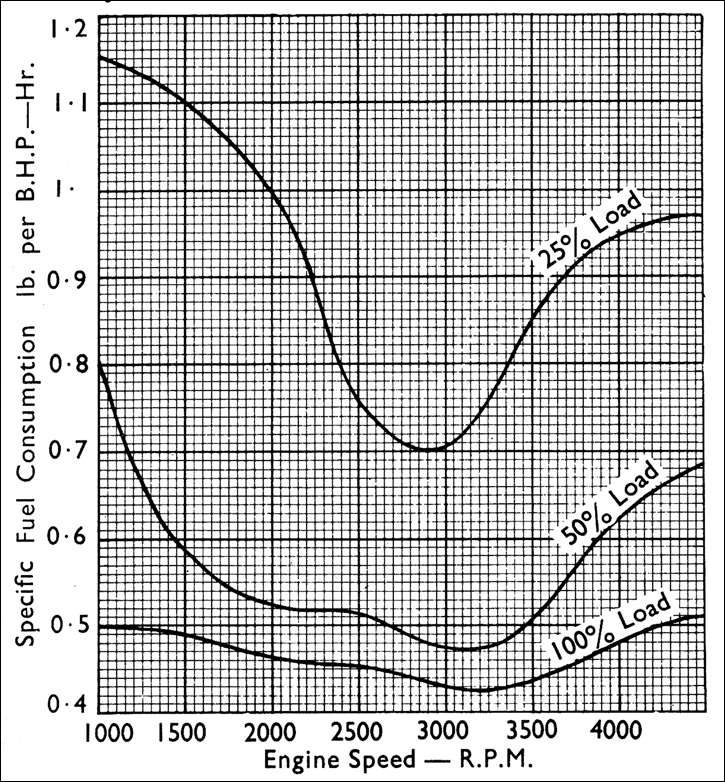
As you can see, the fuel consumption varies with both load and rpm. You could consider this to mean that at a constant speed, on a flat or constant rising road, there is an optimum throttle amount. It is generally bad for an engine to 'cruise' at very high throttle settings and very low RPM. That is called "lugging". For the BMW Airhead engines, due to the design, including primary balancing rpm area, and many other factors, the engines will, OVERALL, prefer to be at 3800-4500 rpm (the R46 and R65 somewhat higher rpm), under mild or relatively flat road conditions. That is, the throttle will be at, perhaps, only about 35%-60%. There is nothing all that strict about this.
If you increase the throttle (but keeping the rpm in that above 'sweet spot'), perhaps doing this by shifting to a higher numbered transmission gear, mileage goes up. Don't overdo this, as lugging is a bad idea.
There are many rear end ratios used on the BMW Airheads, so I cannot give hard and fast rules, except what I said above, ~35-60% throttle, and ~3800-4500 rpm. The engines are certainly capable of cruising vast distances at much higher throttle and/or rpm, but fuel mileage suffers. If you are in any gear, with a constant throttle setting,...... & opening the throttle some additional amount does NOT accelerate the motorcycle, then you are in the potential LUGGING AREA, so SHIFT DOWNWARDS as needed if more speed is needed. NOTE ALSO, that using excessive throttle amount to maintain modest speeds is also potentially lugging, which can be damaging. Lugging increases cylinder pressures, and heat and IF EXCESSIVE WILL CAUSE SERIOUS ENGINE DAMAGE!
Here is another fuel-robbing situation. The alternator uses engine power. The more electricity you use, the less the mileage.
The higher the numerical rear drive ratio, the more RPM for a given speed, the more friction losses in the engine, and often the more throttle used.
Things ADD UP!
PART 7, Fuels, jetting, poor mileage due to problems, ETC. There can be many reasons for poor mileage; here are SOME of them:
(1) Alcohol-laced fuels (Gasohol).
(2) Winter fuels, with their higher volatility less power-producing ingredients.
(3) Problems with the emissions control items, such as from the electric solenoid valves and the one-way valve going into the crankcase. These items are found on late Airhead California models and may be found in total or in part, on other State and Country models.
(4) Any engine with wrongly jetted carburetors; perhaps an R80 engine with wrong jetting right from the factory. Article is on this website: https://bmwmotorcycletech.info/R80-fuel-mileage-problems.htm.
(5) Defective carburetor floats, or excessively high fuel level setting.
(6) Extremely dirty air filter. Rodent nest problems in that area.
(7) Use of high speeds.
(8) Use of higher ratio rear end ratio gears.
(9) Defective ignition spark coil, wires, caps.
(10) Use of large alternator output.
(11).....
Part 8, RAM AIR:
Sometimes folks ask questions about RAM AIR possibilities for "no-cost" supercharged horsepower. I will give an example, and keep the mathematics quite minimalized:
Consider your Airhead or any other motorcycle, or, really, any other vehicle.....moving at 68 statute miles per hour. That is easily converted to feet per second, and the value is 99.7. I will just use 100 feet per second. There is about 12 pounds of pressure per square foot of surface area (this is over and above atmospheric static pressure). At 200 feet per second (about 136 miles per hour) the added pressure is 48 pounds per square foot. I won't complicate this short section with such as the drag being 4 times higher for a doubling of speed, and other such things. What you are likely interested in is obtaining 'free' horsepower from ram air supercharging.
If we divide by 144, we then have the pressure per square inch, in my example this is 0.33. We commonly measure pressure in the USA in pounds per square inch (PSI). This means that the supercharging effect, nothing else considered (such as HEAT rise from pressure, which lessens the usable effect), at 136 mph, is only 0.33 psi.
That is quite small compared to atmospheric pressure forcing itself into the cylinders (about 15.0 psi at sea level). Thus any ram-air-supercharging effect is very small .....until speed gets VERY high. Once the speed is high enough, the pressure rise is more and more usable ....because of that SQUARED function I mentioned earlier. Speed starts to make some reasonably usable difference around 150 mph, all things considered. Thus, ram air pressure does NOT help at ordinary road speeds. The next question is, typically, why not use a big scoop. NO, 'big scoops' don't increase that pressure and performance due to the mathematics and area involved.
Part 9, Horsepower, Torque, miscellaneous:
1. Several methods of 'proving' an increase in performance come to mind. The best testing is on a dyno (dynamometer)....with the temperature and humidity of the incoming combustion air being measured and written down and accounted-for; and also having fuel flow instrumentation. Dyno's cost $3K upwards, and are expensive to rent. But, they are really great, especially if you use the same dyno for all testing. A decent dyno is good enough to compare between readings on the same dyno; but not all that great for absolute measurement values. Very fancy dyno's can cost over $100,000.00.
2. The second best method is often a top speed run, same loading/equipment and rider position, clothing, etc. You can compare, before & after modifications. Use the same road area, same temperatures, same atmospheric pressure, same wind (if any), same direction. Calculations could be done based on actual measured increase (or decrease) in top speed, to get an idea of the real Cd. Runs in two directions within minutes tends to average out any wind. Yes, if you are a bit clever, you can calculate Cd from performance increases from the basic Cd formulas.
3. A speed run up a slope can tell you a lot, and an advantage is that often it can be done at legal speeds. Typically this is done on a slope that allows, let us say, third gear and 6000+ rpm or so (Airheads) at wide open throttle (WOT)...and the slope is such that it won't allow any more speed in a particular gear, or, only some. This is one of my preferred methods. I also often use this sort of test over perhaps half a mile, to determine mixture, reading spark plugs or exhaust gases.....etc. I have one particular stretch of road where I have been doing this up-slope testing for decades now.
4. Acceleration testing can be done with a stop watch, over different speed ranges, and sometimes offers some decent measurements. For just a drag-race start method, there are too many variables to consider, and so it is generally a poor method, unless you can have relatively tight control over things. Where acceleration testing can work out well, is a roll-on test, from a given rpm & speed in a given gear, and the same stretch of road.
5. In the United States, horsepower means "Imperial" horsepower. The original description is the power a horse exerts in moving 550 pounds of something, one foot in distance, in one second. It can include just the horse and its own weight. Horsepower can be defined many ways. Just one such is that ~746 watts is one horsepower.
The term brake horsepower (BHP) came from the measuring of horsepower by a device called a water brake. A 'brake' loads the engine ...and the twisting force, called torque, is then measured. It can be measured directly, with such as strain gauges, or indirectly. BHP is crankshaft measured, unless specified at some other point, such as transmission output or rear wheel output. Today, hydraulic brakes, water brakes, electrical brakes ...etc. ...are all in use in measuring BHP. Typically, however, we have some sort of turbine ...and a means to adjust characteristics, such as amount of loading.
Shaft horsepower is NOT the same thing as BHP. It is supposed to mean BHP, less certain losses. In practice ....especially decades ago with the advertising of puffed-up horsepower claims of car manufacturers ....horsepower was measured at the crankshaft, often without alternators/generators, water pumps, etc. .....all these power draining devices were eliminated ...and sometimes some real cheating was done ....like measuring power at unlikely cold and very dry temperatures, ....even using different air pressures, no exhaust back pressure or optimizing the exhaust system for best extraction and input characteristics at a very specific rpm; ....and changing the coolant temperature to non-real-world temperatures.
6. Formulas to calculate BHP:
BHP = 2 x pi x torque x revolutions; all this divided by 550.
Pi is 3.1416 and torque is in pounds-feet, and revolutions in THIS formula are revs per second NOT MINUTES! Obviously, we can change the revs to revs per minute, easily!
Here's another version:
P = 2 x pi x torque x rpm x 1.34 x 10⁻³. Divide the results by 60. For this formula P is in horsepower and torque is in Nm.
7. Today, SAE (Society for Automotive Engineering) testing methods and specifications do not allow the large inflated values from the 60's and 70's. SAE standard conditions are 29.61 inches of pressure of mercury atmospheric; 81 degrees Fahrenheit incoming air temperature; and 60% relative humidity. These are real world numbers. Just what is what on exhaust, etc....well, yes, exaggerated values still exist, just not quite so large. For your Airhead, say an older R100 with stock higher compression ratio, rated at, say, 70hp, you will likely, on an accurate dyno, get around 51-54 hp AT THE REAR WHEEL.
There are other types of measuring standards. You may have heard of the ISO international standard. This is often seen on threaded fastener specifications. ISO for horsepower is not measured exactly the same way as SAE, but it is only a couple of percent different (higher).
8. Note that both Imperial and metric power can be expressed, and often is (see BMW spec sheets) as Kw (kilowatts). Metric horsepower is now larger than Imperial ...since it is measured in the real, supposedly on-road world ....but not always ....some fudge factors exist ....I am speaking theoretically here about metric hp being larger than Imperial hp. You can usually assume that metric power times 0.986 gives Imperial. You can calculate Kw into Imperial, by dividing by 0.746.
9. I won't go into it deeply here ....many folks HATE math and formulas ...but you probably have noticed that you CANNOT separate a torque effect from a horsepower effect, and vice versa, due to that formula in #6. above. Because of the formula, and some other things, there is a place on every torque and horsepower curves chart, where both curves are shown, where they CROSS-OVER. It is ALWAYS at the same RPM. You cannot separate the interrelationship; if you change one item, at least one other is changed ...torque times rpm is horsepower. If you are math savvy, or curious enough, you should be able to figure out the RPM for the crossover point. IF you can show me, via E-mail, just how you did that (and, copying a formula or answer won't do), then you get a handful of FREE, via E-mail, answers to your technical questions about Airheads. Mention that you saw this as 9. in the fuelmileage.htm page.
If you answer the next question with the correct answer, showing your own reasoning, you get TWO handfuls or maybe a freebie of something on my Sale page:
What happens if the engine is locked so it cannot rotate, but you ignite the mixture via the spark plug, let's say the piston is at just barely past TDC on the compression stroke. The piston
can not move. Just what DOES it mean regarding torque and horsepower? I just thought I'd drop that in here ...and let some old time steam engine enthusiasts (and?) have a tad of fun.
Premium fuels versus mileage and combustion temperatures:
There is an old controversy over possible increases in combustion chamber temperatures, etc., when using premium gasoline's in lower compression BMW airhead engines, where higher octane is usually not needed.
Gasoline burns at about the same rate under normal, that is, not detonating, etc., conditions. The output (BTU) per gallon of Premium gasoline is potentially ...or even likely ...to be a small amount LOWER than for Regular. I think it is likely that SOME premium gasoline's WILL give LOWER gas mileage than regular gasoline ...assuming here that the engine will run properly on Regular grade gasoline in the first place.
Temper this with the fact that gasoline formulas change, and also change between summer and winter grades of gasoline. Winter gasoline contains rather volatile things like butane or propane. In the West, California in particular, oxygenates are added to most fuels, and have been for decades. The entire USA now uses at least one oxygenate product, ethanol. The addition(s) GENERALLY cause ~5-10% POORER gas mileage. They are not good for your engine, carburetors, hoses, etc. Without jetting changes, they make a carbureted engine run leaner. The fuel mileage decreases from just the ethanol content ....AND! ... decreases even more, perhaps another several %, when you rejet for performance with such fuels.
Rev:
05/25/2009: Initial release.
01/03/2010: Slight updating.
06/01/2011: Cleanup.
09/28/2012: Add QR code; add language button; update Google Ad-sense code, add Additional Information section.
10/04/2012: Merge information from hp-drag.htm article, so that it could be eliminated. Go over this whole article.
12/09/2012: Add shapes chart.
03/05/2013: Add comments "Some Special Details" and the fuel-rpm-load chart.
09/02/2013: Clean up article. NO important details changed. Language button removed sometime in 2013.
01/18/2014: Clarify some details.
03/05/2014: Updated in several areas, add more vehicles, charts, conclusions.
12/04/2014: Expand article more regarding Cd, with more charts and comments.
03/04/2016: Meta-codes; left justification; metatags, etc. Still needs narrowing and final meta's, etc....to be done later this year.
06/28/2016: Update metacodes, scripts checked, improved descriptions, enlarged font sizes, full justify left, full length lines, etc.
08/02/2016: Add section, prev. in InExTuning article: Premium fuels versus mileage and combustion temperatures.
01/23/2017: Fix totally wrong hyperlink in Part 7 (4). Clarify some things in Part 6.
03/27/2017: Fix typos, improve clarity.
01/05/2018: Top down overhaul of entire article. Reduce excessive html, fonts, colors. Improve layout, including all chart data now put into formal tables. Improve explanations. Add 10pxl margins.
09/23/2022: Add emphasis where needed, improve some explanations.
� Copyright 2022, R. Fleischer
Return to Technical Articles List Page
Last check/edit: Wednesday, August 16, 2023